Recently, the analytics of human resources and team co-operation has become a “new black” of staff management, gaining a great deal of interest and general acceptance. At the same time, most companies lack a full understanding of the importance of human resources and team network analysis in the management of a company’s team performance, as well as in business processes and development. The Deloitte Human Capital Trends Report 2019 shows that only 26% of companies make effective use of technology and analysis, despite the fact that 71% of companies mention human resource analysis as a top priority.
Team co-operation analytics
Historically, human analytics has been based on attribute analysis using two types of attribute data: traits that are facts about individuals that do not change (ethnicity, gender, employment history), and status, which involves facts about people that do change (age, level of education, value of bonuses received, length of service, etc.). Attribute analysis is necessary but not sufficient.
Team co-operation is a new discipline called relational analysis, meaning that relational data determine interactions and co-operation, such as communication between two employees in different departments. Thus, relational analysis can be called the science of human daily communication and co-operation or “social network”.
Currently, countless studies confirm that the co-operation and interaction of the team, along with the individual characteristics of the employee, reflect work performance. The key is to find ‘structural signatures’ – data models that correlate with some good (or bad) performance. Just as neurologists are able to identify structural signatures in brain networks that are signs of bipolar disorder and schizophrenia, or as chemists determine the structural signatures of a fluid by predicting its kinetic fragility, managers can identify and analyse structural signatures to identify those employees in the company that are most creative or most effective.
Six different structural signatures are defined: ideas, impact, efficiency, innovation, dropout and vulnerability. For example, we will look in detail at the structural signature of efficiency, which helps to predict and determine what team within the organisation will complete a particular project on time.

Image: Harvard Business Review
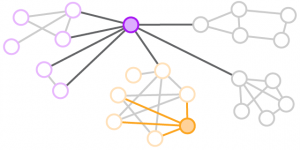
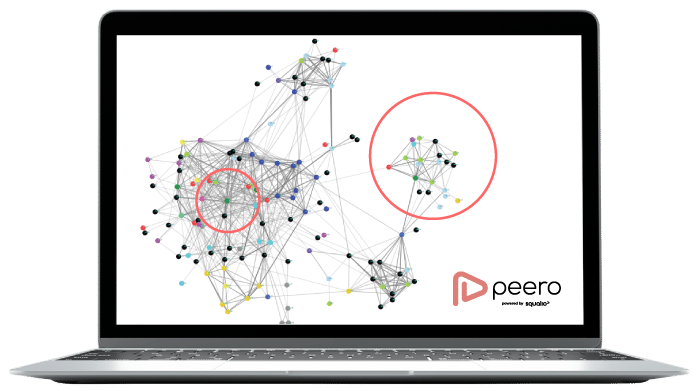
Those team members that are highlighted in green are closely related to each other, thus showing a high internal density, which shows that the co-operation in this team is very good. The external connections of the team members do not overlap, meaning the team has a high external range, which provides greater access to external resources. This example shows that analysis of the attributes above helps to identify qualified employees, but does not ensure efficient work on time. In turn, relational analysis is necessary to predict the most effective solution, because it determines the chemistry of team interaction, as well as the ability to use and apply external information and knowledge.
Contribution to the overall business process
“There are two possible paths to team co-operation analytics,” said Oliver Kasper, director of human resource analysis and digital HR at Swarovski. “One way is to look back and account for what happened in the past. In turn, the second path leads to the future – forecasting and providing solutions based on analytics. In my opinion, only 1-2% of companies take the second path. Similarities can be seen in the differences between a steam train and an electric car – reporting is the steam train, while forecasts and solutions are the electric car. ”

Team co-operation analytics provides significant input and improvement to a company’s overall business processes. Recognition and value technology PEERO APP ambassador, Liesma Rijniece, shares an example of experience, where by identifying and analysing co-operation between a company’s sales and sales support team, the company’s business processes were improved:
- the analytics of team co-operation show that the sales team of the company is extremely cohesive and united;
- on the other hand, the management of the company is not satisfied with this data, because they do not see mutual co-operation between the sales and sales support department;
- both teams – sales and sales support departments – are critically important in the development of business processes, and cannot do their work without each other, but the analytics of co-operation between the two teams show that they are not cohesive and united, as well as their interaction and communication are extremely separate and weak;
- by analysing the team analytics data, as well as talking to both teams, the company’s management realised that the problem did not lie in human communication or specific staff, but in the company’s customer management system – the sales team provides information to the sales support team in a management system, which is a long and arduous process;
- by calculating and comparing how much time a vendor spent entering information into the system on a daily basis, the company’s management concluded that investment in improving the customer management process system would pay off, including due to the fact that the sales team would be able to focus on its core responsibilities, and the sales and sales support teams would be improved.
The above example highlights the true depth and value of team co-operation analytics, which is not just about improving collaboration and communication, but also improving the company’s overall processes.
Team co-operation analytics is a new way for a company and organisation to make data-driven decisions that provide an opportunity to assess the probability of a team, employee, or organisation in general to achieve a goal, creating a more productive, healthier and successful organisation.


